I recently investigated the urban legend that taking a tube ride is as bad for your health as smoking a cigarette. Initially dismissed as ridiculous, new ‘evidence’ has brought the claim back into question.
Read more for a cautionary tale of outdated scientific assumptions, Goodhart’s law and a case for epistemic humility.

Introduction
Over the last decade, poor air quality has been listed as the third-leading mortality risk factor worldwide by Our World In Data, behind smoking and high blood pressure.
More locally to me, much ado has been made about London’s new Ultra-Low Emission Zone. A new charge was introduced for the most polluting cars driving in a wide area around London. The political will for this charge was fuelled by poor air quality and poor respiratory health outcomes in the capital.
This increasing focus on air quality has made me turn to the question of air quality on the London Underground.
If you have taken a ride on the tube, you may have noticed that the air is dirty. You might have seen the inexplicably dusty walls, a haze as you look down a long platform, and (sorry) the sooty residue in your tissue when you clear your nose after a long commute.
I became interested in how much impact this might be having on Londoners’ health. There are up to 5 million journeys on the tube a day, so if there are health hazards, the London Undergroud could be an effective lever for improving respiratory and cardiovascular health outcomes for residents of London.
It’s important to note however that the vast majority of air pollution related deaths happen in low and middle income countries. The question is of local interest, but low importance compared to the scale of the problem world wide.
We should strive for better air quality.
Poor air quality is treated as an expectation, or a reasonable trade-off for living in a bustling economic hub. Some historical perspective can help us to reject this expectation, though.
It’s been pointed out that cholera and dysentry used to be a fact of life in the city. In the 1800s, London saw three outbreaks of cholera, killing upwards of 50,000 people in each outbreak. Once humanity got a grip on the causes and impacts of those diseases’, however richer nations developed their sanitation infrastructure and effectively eradicated waterborne disease.
Now it’s claimed that there could be up to 4000 deaths per year from toxic air. We should reject those unnecessary deaths as we do now death from cholera, and expact improvement to our air filtering infrastructure.
It’s plausible to me that we’ll look back on air quality in the last 200 years as we now look on water quality leading to mass cholera outbreaks in early victorian cities. I hope we’ll scoff at how primative our understanding and ambition was for safeguarding respiratory health.
Air quality background
First let’s cover some background facts and terminology around air pollution and its impacts.
PM2.5 is any particulate matter (PM) that’s less than 2.5 micrometres in diameter. That’s 2.5 x 10⁻⁶m, or 0.0025mm. It doesn’t matter what the particle is composed of, to be classed as PM.

PM2.5 is thought of as the worst air pollutant, because it’s extremely pervasive: it’s small enough to be suspended in the air and to get all over your body (including the lungs, blood and brain).
There’s some uncertainty about whether smaller particulate matter, PM0.1, is even worse. This assumption hasn’t been tested widely because PM0.1 particles are harder to detect and count, in air samples.
Many epidemiological studies have strongly linked exposure to PM2.5 with cardiovascular problems, respiratory problems (like asthma) and even neurodegeneration, as these particles end up in the brain.
Based on this evidence, the World Health Organisation (WHO) sets targets for air pollution levels; major cities like london are usually well over these levels.
| Average PM2.5 concentration target for annual period. | < 5 microgrammes per metre-cubed. |
| Max PM2.5 concentration target for 24 hour period. | < 15 microgrammes per metre-cubed. |
| Ambient air pollution in London. | 10 microgrammes per metre-cubed |
Shockingly, we know very little about the mechanisms by which PM causes harm. Our best guess is that PM2.5 causes inflammation wherever it ends up, which in turn is known to cause circulatory problems. In the brain, there’s uncertainty about whether damage comes from heavy metal deposits (corresponding to well-known damage pathways from lead exposure), or all types of PM.
Knowing so little about the mechanism means we know little about how much composition matters, whether intermittent exposure is as bad as persistent exposure, and so on.
PM usually comes from partial combusion of fuel in vehicles or power production. On the London Underground, PM comes from iron rails and passenger skin, and sticks around due to lack of ventilation (e.g. it’s worst on the Victoria line, whose tunnels are closed at both ends).
History of health concerns about the London Underground
We’ve known for a long time that the particulate matter concentration in the London Underground’s (LU) air is high, but we have few further details on the impact of this to this day.
A 1998 Government report stated (amongst other conclusions) there was a case for:
- More work to be done on the composition and particle-size distribution of Underground dust.
- An epidemiological study of the effects on health of exposure to Underground dust.
Sadly, we’ll see that neither of these recommendations have been fulfilled 20 years later. The lack of interest in understanding the health impacts of the LU may follow one of the other conclusions put forward in that paper:
“The risk posed to health by the quartz content of underground dust was likely to be low”
This is an assumption we’ve made for 30 years, and practitioners are now less sure if it’s true. Minimal work has been done to understand the importance of PM composition, and all WHO targets focus on PM concentration regardless of composition.
Soon after that government report, in 2001, a researcher at University College London claimed in his academic bio that LU air quality was so bad that taking a 20 minute tube ride was equivalent to smoking a cigarette. He made the equivalence based on mass of particulate matter inhaled; I haven’t spent time verifying this calculation, but it seem right, to within at least 1 order of magnitude.
This factoid equating riding the tube to smoking was quickly picked up by the media and entered Londoners’ folklore – in fact I started looking into this question when the equivalence was repeated to me by a friend.
The response from the academic community at the time was, however, not much more than a scoff. A rebuttal paper was commissioned in 2003, and it opened its conclusion stating:
Public and workforce anxiety may be generated by speculation, sometimes uninformed, about hazards from industrial processes or operations. Indeed, such scares are commonplace and often welcomed by the news media. In most instances, facts are hard to come by and evidence of adverse human health effects is not available.
Seaton et al., 2003 (bolding added for emphasis)
The paper ultimately dismissed concern about tube air quality being as bad as smoking on 3 bases (which I’ll discuss more below):
- There’s less ultrafine (PM0.1) pollution on the tube than outside. PM0.1 is particulate matter less than 0.1 micrometers wide. There’s less of it on the tube because the PM is generated by mechanical grinding of tracks, rather than partial combustion of already-tiny particles in fuel. PM0.1 is generally thought of as more deadly because it’s smaller and more pervasive – but this assumption is less well-evidenced than claims about PM2.5, as it’s harder to measure PM0.1 concentration. This may well be the case, and we’ll return to this point in the conclusions.
- PM2.5 on the tube comprises iron-based particles. The authors conclude that because iron oxides are non-toxic, they’re unlikely to cause harm. Modern sources state we are actually uncertain about the mechanism that causes the scale of harm we see from air pollution, so this assumption seems less clearly true to me now.
- Tube PM2.5 concentrations for iron-based particles are within recommended guidelines for welders. It wasn’t clear to me that these guidelines are particularly well evidenced in the first place, but that was the baseline the authors chose to compare to.
Since these conclusions were made, very few people have thought seriously about air pollution on the tube.
However there are 3 facts that have emerged since 2003, and raise new reasons to return to the question of LU air quality:
- The WHO sets a 24 max concentration target of PM2.5 of <= 15 microgrammes per metre cubed, regardless of composition.
- Air pollution is (now) known to be the 3rd mortality risk factor worldwide.
- On the tube, PM2.5 concentration can be up to 800 microgrammes per metre cubed – 100x more than the ambient air.
What’s changed since 2003?
More knowledge about air pollution
We’ve learned a lot more about the health impact of air pollution, which led to the WHO setting strong targets on air pollution levels.
There is strong and growing epidemiological evidence of a causal relationship between fine particulate matter air pollution (PM2.5) and excess deaths, controlled for a range of factors.
The WHO says:
[PM2.5] is the most dangerous pollutant because it can penetrate the lung barrier and enter the blood system, causing cardiovascular and respiratory disease and cancers.”
However these focus on PM2.5. What happened to the earlier conclusion that PM0.1 is more damaging, therefore we shouldn’t worry about LU pollution?
We now know PM2.5 on the LU is extremely high
In 2020, hard data was finally gathered and publicly released about air quality on the LU. This is largely thanks to the mammoth effort of a researcher riding up and down every line. I hope they had a good podcast to listen to.
We can now quantify that PM2.5 concentrations on the LU are extremely high – up to 60 times more than WHO targets for maximum 24 hour maximum exposure to PM2.5, and outdoor levels. If concentration multiplied by time scales linearly, then 0.5 hours on the tube could be well over WHO limits.
The graph certainly looks concerning.
We’ve largely forgotten about PM0.1 since 2003
Notably, WHO guidelines cover PM2.5 but not PM0.1. Why was that, despite scientists being confident enough to be more concerned about PM0.1 in 2003?
I expect that PM0.1 is not in the metric because PM0.1 particle numbers are hard to measure. This is a terrible reason to not be focused on this type of pollution, and I feel it ought to be righted in the field.
The effect of it being hard to measure, thus left out from scientific attention, is cyclical:
- Fewer studies have been conducted on the health impact of PM0.1.
- The WHO therefore couldn’t reasonably set a target involving PM0.1.
- Therefore fewer studies are conducted on the health impact of PM0.1.

There are many fewer results when searching for information about PM0.1.
So we seem to have largely forgotten about our initial concern for PM0.1 in favour of optimising for measuring and reducing PM2.5.
This could mean we’re overly worried about PM conentration on the LU now, because there is relatively less PM0.1 on the tube than in the ambient air.
In the WHO’s defence, a high PM2.5 concentration is perhaps usually a fine proxy for PM0.1: there’s no smoke without even finer smoke.
However on the tube, PM2.5 is not a good proxy for PM0.1. This might be one of the few environments where PM0.1 does not track PM2.5 concentration: as the source is mechanical, the chunks of track and wheel that enter the air are generally larger.
The immediate risk is that I and others are overblowing tube risk due to WHO targets rather than the facts of air pollution. On the flipside, there may be interventions to target and reduce PM2.5 that are completely overlooking PM0.1 and therefore not solving the real problem.
There may be other such situations where there’s a large amount of PM0.1 and not PM2.5, or vice versa.
This is a classic case of Goodhart’s law: when the measure (or in this case, proxy) becomes the target, it’s no longer a good target.
We know the composition of PM on the LU, but not what it means
Modern studies acknowledge uncertainty about the mechanism by which PM2.5 causes damage, and usually don’t discuss composition of PM2.5. So are carbon-based particles worse than iron particles? We might assume so from toxicology, but I’m not aware of any proof that toxicity is what causes health impacts, over potentially mechanistic irritation causing inflamation.
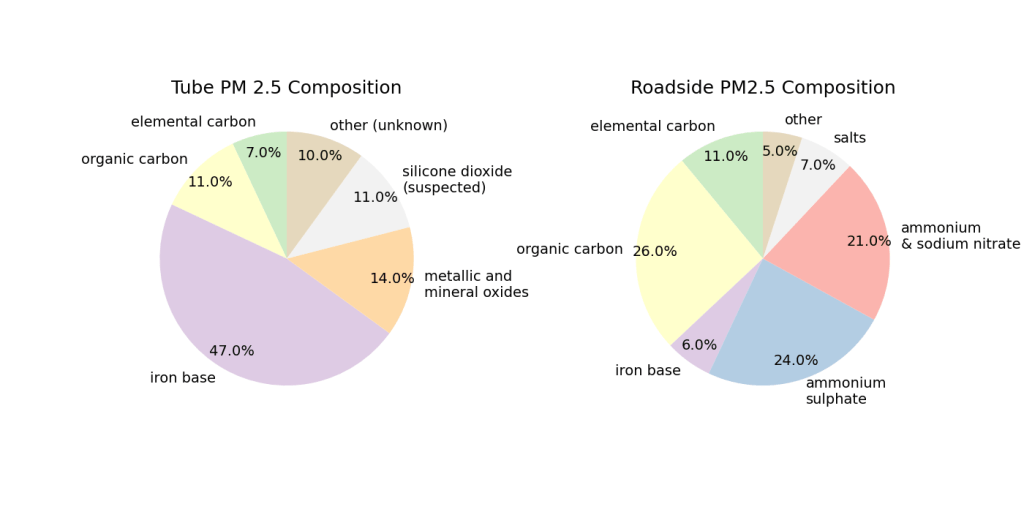
If organic carbon causes more inflammation than iron-based particles, this would be good reason to dismiss concern about the tube. This is our current assumption, but it’s almost completely untested epidemiologically. That is, we haven’t measured the health impact of PM2.5 composition on a population level.
Conclusion
30 years into the debate about the impact of air quality on the tube, we still know far too little about air quality to be able to answer how concerned we should be about it.
This has huge implications for the field of air quality research in general. I feel we ought to do the following:
We ought to know more about the mechanism of harm caused by PM2.5, PM0.1, and their compositions. We could be commiting one of two major mistakes, at our current level of knowledge:
a) We are at risk of focusing on the wrong pollutant, by following the WHO’s guidelines. Reputable researchers were confident enough to be more concerned about PM0.1 in 2003, but very few studies have focused on PM0.1 over PM2.5 since then.
Is PM2.5 a reasonable proxy for PM0.1? Not on the tube, but perhaps for combusion-sourced PM.
Did we choose PM2.5 because there was more evidence for it being harmful? This is a vicious cycle – we are at risk of studying the wrong pollutant because we set a metric based on what we can be sure about, rather than what is worse in expectation. We must disambiguate which is worse, fast: PM0.1 or PM2.5. This is becoming more possible as measurement instruments get more sophisticated, but the lack of WHO attention on PM0.1 may reduce scientists’ appetite to work on it.
b) It’s possible we have wrongly, institutionally dismissed dismal air quality on the London Underground on outdated assumptions. Since 2003, we’ve both learned a lot more about the health impact of air pollution, and acknowledged more uncertainty about the mechanism of damage. As long as this uncertainty is well-guided and not a case of insitutional forgetting (see conclusion 2 above), then we ought to revisit the tube’s health impacts with modern knowledge.
Thankfully these uncertainties are known and have been recommended by the UK’s Committee on the Medical Effects of Air Pollutants. But given the limited data on the tube currently, there’s still a field to build around this question.

Leave a comment